As is usually the case with Micron (NASDAQ:MU), shares have been highly volatile so far this year. The year-to-date numbers for MU stock show a gain of “just” 8%, but that has hardly been the case.
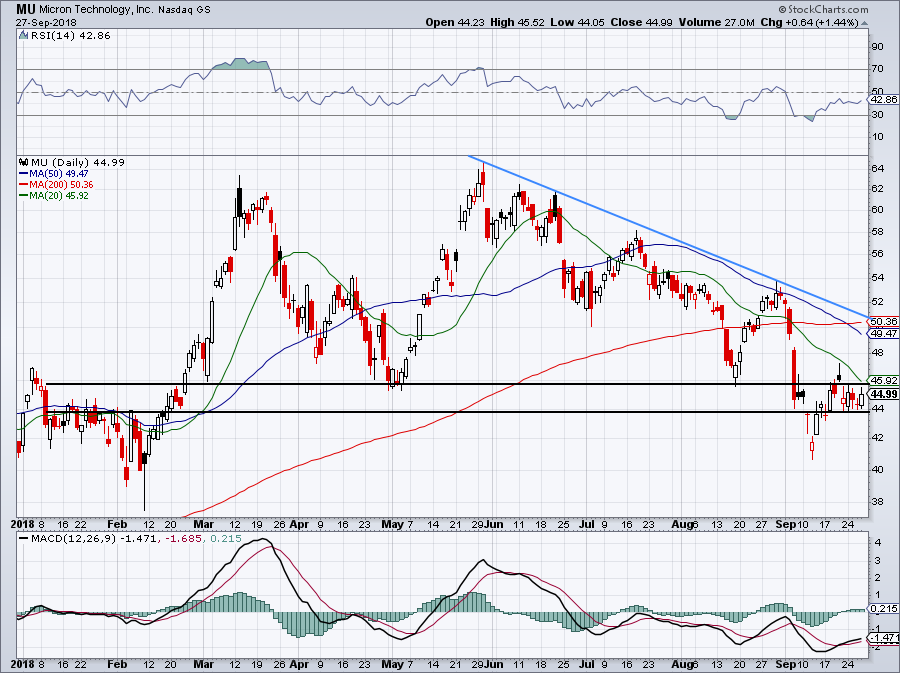
For instance, it ignores the more than 50% rally from mid-February to mid-March, the 30% decline that followed and lasted until the end of April, then the ~40% rally that occurred in May. After ending near $64 that month, shares have been cascading lower, now trading near $44 per share.
How can a stock that trades at 4 times earnings be so darn volatile? And how can it trade at just 4 times earnings in the first place? MU stock has to be one of the most interesting names in the equities market as a result.
Valuing Micron Stock
MU reported earnings recently. And with that report, it beat earnings and revenue expectations. Sales of $8.44 billion grew 37.5% year-over-year, while earnings of $3.53 per share came in 19 cents ahead of expectations and grew roughly 75% YoY.
For the year, MU generated GAAP earnings of $11.51 per share, leaving Micron stock trading at just 3.9 times its fiscal 2018 earnings. That’s such a low valuation it’s honestly hard to fathom it.
However, Micron has historically operated in a very cyclical business climate. Meaning that, there are times of boom and times of bust. So far, the DRAM cycle (responsible for about 70% of Micron’s sales) has been holding up pretty well, although pricing pressures are clearly here and on the horizon as well.
From CEO Sanjay Mehrotra, “In the fourth quarter, we set revenue records across all our major markets, from automotive and industrial to mobile and cloud datacenters.”
That’s good to see for investors, but some comments on the conference call weren’t as encouraging. Specifically saying things like “moderation in supply growth” and talks of “transition” through 2019. It didn’t help that that management guided for Q1 sales of $7.9 billion to $8.3 billion and earnings-per-share of $2.87 to $3.02. Both metrics fell short of consensus expectations calling for sales of $8.4 billion and earnings of $3.06 per share.
Still, we’re talking about a stock that trades at 15 times first quarter earnings. For the year, expectations call for 1.8% sales growth and an 11% decline in earnings. It’s worth pointing out that Micron had substantial growth in 2018 vs. 2017, while being practically profitless in 2016.
Trading MU Stock

While predictions calling for a decline in earnings this year isn’t great, at some point, we have to assume that’s priced into the stock. After all, sub-4 times earnings is a joke! But investors can yell about the valuation until they’re blue in the face. That doesn’t mean it will change as a result.
We can’t change the valuation, but we can read the charts. What do they say?
On the one-year daily chart above, we can see that $44 is a decent level to take note of, as is $45. For now, MU appears trapped in that tight range, but I wouldn’t expect it to stay there long. Conservative bulls who are long can use a close below this range as their stop-loss.
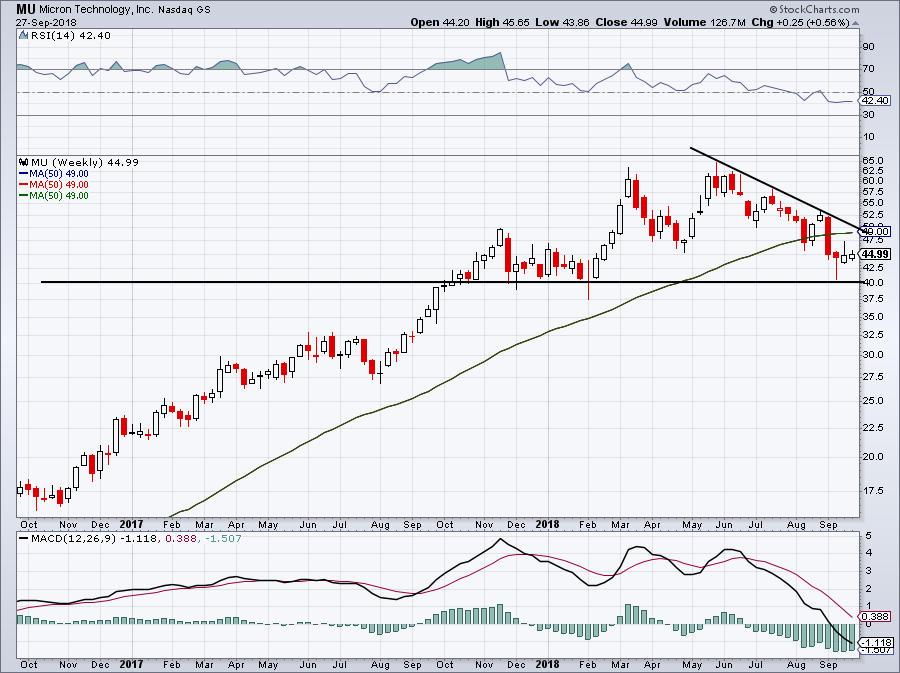
Traders can consider buying a breakout over this range and the 20-day moving average, looking for a retest of downtrend resistance (blue line) and the 50-day moving average. On the two-year weekly chart below, you can see what a significant level $40 is, an area investors may consider going long should MU stock pullback that far.

So is MU a perfect fourth-quarter buy? It needs to regain some momentum, but if it can, MU could be a big-time performer. Let’s put it this way, Needham analysts slashed their price target 20% from $100 to $80, but that still implies 80% upside from current levels.


